



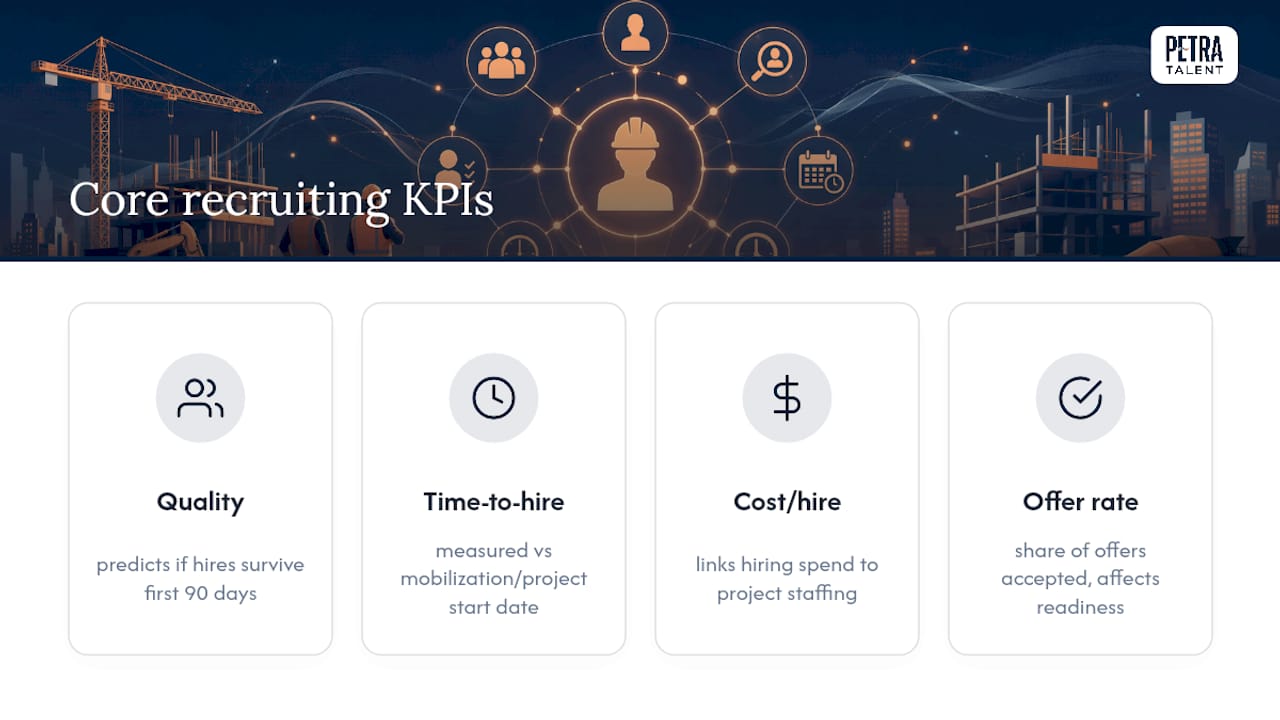
The KPIs that matter most for construction hiring are time-to-hire, cost-per-hire, quality of hire, 30/90/365-day retention, offer acceptance rate, source and channel effectiveness, and time-to-productivity. Track all seven, but if you can only build discipline around three, start with quality of hire, time-to-hire, and cost-per-hire. Those three drive the outcomes that actually protect a project schedule.
Here’s why each one earns a spot on your dashboard:
- Time-to-hire / time-to-offer: A slow requisition delays mobilization and pushes back the whole crew schedule.
- Cost-per-hire: Recruiting spend that outpaces project margins signals a sourcing or process problem.
- Quality of hire: A technician who underperforms or quits at 60 days costs more than a slow search ever did.
- 30/90/365-day retention: Early turnover on a jobsite creates safety risk and re-mobilization costs.
- Offer acceptance rate: A dropping acceptance rate usually means your offer package or process is losing candidates to competitors.
- Source/channel effectiveness: Not every job board or referral program produces workers who stay past week one.
- Time-to-productivity: A hire who takes 12 weeks to reach full output on a critical-path task is a different problem than one who takes four.
Placement-verified data on locked-in construction searches shows a median submission-to-hire timeline of just 10 days, with roughly 10% of submissions converting to interviews. That benchmark is a useful gut check for how tight a well-run pipeline can be.
TL;DR:
- Prioritize tracking quality of hire, time-to-hire, and cost-per-hire, as they directly influence project staffing outcomes and schedule protection.
- Set role-specific KPIs based on role families, targeting a 30-day time-to-hire for leadership roles and up to 90 days for specialized trades.
- Benchmark KPIs against regional data and past hires, adjusting targets through a three-stage process that accounts for role urgency and project phase.
- Use dashboards with different review cadences: weekly for requisition status and interviews, monthly or quarterly for retention and quality metrics.
- Diagnose KPI fluctuations by examining compensation, onboarding, and internal delays before implementing interventions, monitoring leading indicators over lagging retention results.
Table of Contents
- What Are Recruiting KPIs and How Do They Differ From Metrics?
- Top Construction Recruiting KPIs: Formulas and Benchmarks
- How to Set Targets by Role, Project Phase, and Urgency
- Dashboards and Reporting Cadence: What to Watch and When
- When a KPI Moves: Diagnosis and What to Fix
- How Petra Talent Applies KPIs to Mechanical Construction Hiring
- Examples of Effective Recruiting KPI Implementation in Construction
- Turn KPI Tracking Into Staffing Readiness
- What Actually Moves the Needle in Construction Recruiting
- What This Guide Gets Right That Most KPI Advice Misses
- Sources
What Are Recruiting KPIs and How Do They Differ From Metrics?
A recruiting KPI ties directly to a business outcome: did the hire show up on time, perform well, and stay? A metric is any number you can count. The difference matters because construction companies drown in metrics that feel productive but predict nothing.
Applications received, job posting views, and number of phone screens completed are activity metrics. They tell you people are busy. They don’t tell you whether the pipeline is producing workers who finish the job. A recruiter who screens 80 candidates a week looks efficient on paper, but if none of them survive the first 90 days on-site, that “efficiency” is waste at speed.
Consider a real construction scenario: a superintendent requisition sits open for 45 days while the recruiting team reports “12 candidates sourced” and “6 interviews scheduled” as proof of progress. Meanwhile, the mobilization date for a $4 million project slips by three weeks because no one is tracking staffing readiness against the actual start date. The activity metrics looked fine. The outcome KPI, time-to-start, was flashing red the whole time.
Industry guidance converges on a core set of KPIs, quality of hire, time-to-hire, cost-per-hire, and offer acceptance, precisely because these connect hiring activity to whether the project actually gets staffed and stays staffed. Everything else is supporting detail.
Top Construction Recruiting KPIs: Formulas and Benchmarks
Here’s how to calculate and benchmark the KPIs that matter, segmented for construction hiring realities.
-
Time-to-hire / time-to-offer. Formula: date offer accepted minus date requisition opened. Track this in your ATS by role family, not as a single company-wide average. Construction-specific benchmarks recommend a 30-day target for mission-critical field leadership roles, while specialized technical or licensed trade positions often run 45 to 90 days. Capture requisition-open date, first-submission date, and offer-accepted date as separate ATS fields so you can isolate where delays happen.
-
Cost-per-hire. Formula: (external recruiting costs + internal recruiter time + advertising + agency fees) divided by number of hires. For construction roles, build in onboarding costs like drug screens, background checks, and safety certifications, since these are mandatory and substantial. Skipping them understates true cost and makes budget comparisons misleading.
-
Quality of hire. This is the hardest KPI to measure and the most valuable. A practical composite score combines a 90-day supervisor rating, 90-day retention status, and first-quarter productivity into one number. When full performance data isn’t available yet, that three-part composite is a reasonable stand-in. Structured interviews paired with validated assessments raise predictive accuracy dramatically compared to unstructured gut-feel interviews, so investing in interview structure pays off directly in this KPI.
-
Retention cohorts (30/90/365 days). Track separately, not as one blended churn number. A 30-day departure usually points to a bad job-fit or onboarding failure. A 365-day departure often points to compensation or advancement gaps. Construction crews should aim for 90-day retention above 85% for skilled trade hires; anything lower warrants a review of your screening or onboarding process.
-
Offer acceptance rate. Formula: offers accepted divided by offers extended. A declining rate is an early warning that your compensation package, start-date flexibility, or candidate experience is losing ground to competitors bidding for the same labor pool.
-
Source/channel effectiveness. Calculate cost-per-hire and 90-day retention rate separately for each sourcing channel, referral, job board, agency, and trade school partnership. A channel that produces cheap hires who quit in six weeks is more expensive than one with a higher upfront cost but strong retention.
-
Time-to-productivity. Define what “fully productive” means for each role (hitting a specific output rate, working independently on a task type) and measure the days from start date to that milestone. This is the KPI most directly connected to schedule risk, since a slow ramp on a critical-path role delays downstream trades.
How to Set Targets by Role, Project Phase, and Urgency
Company-wide averages hide the differences between roles that behave nothing alike. A project executive search and a licensed electrician search shouldn’t share a time-to-hire target.
Start by grouping openings into role families: field leadership (superintendents, project managers), skilled trades (electricians, pipefitters, HVAC technicians), and technical/office (estimators, safety managers, coordinators). Set a separate baseline for each family using your last 12 months of ATS data.
From there, use a three-stage framework:
- Baseline: What did the last 10 to 20 hires in this role family actually take, cost, and retain at?
- 90-day improvement target: A realistic tightening, often 10 to 15% faster or cheaper, achievable through process fixes alone.
- Annual stretch target: A bigger goal tied to a specific intervention, like a new sourcing channel or revised comp structure.
For mission-critical roles tied to an active mobilization date, don’t sacrifice quality for speed. A superintendent hired three days faster who leaves at 60 days costs the project far more than a two-week delay ever would.
Pro Tip: Use internal benchmarks as your primary target and external industry data only to sanity-check whether your numbers are realistic for your region and specialty. National averages routinely mask regional labor shortages that make your local targets look artificially aggressive.
Dashboards and Reporting Cadence: What to Watch and When
Not every KPI deserves the same attention frequency. Mixing daily tactical numbers with quarterly strategic trends on one dashboard buries the signals that matter.
Weekly (operational dashboard):
- Requisition age by role, flagged red past target thresholds
- Active pipeline count by role family
- Interview-to-offer conversion rate
Monthly or quarterly (strategic dashboard):
- Cost-per-hire broken out by sourcing channel
- 90-day retention trends by role family
- Quality-of-hire composite scores over time
Align your strategic review cadence with project milestones rather than the calendar alone. A quarterly review that happens to fall two weeks before a major mobilization date is more useful than one that lands mid-project with no decisions to make.
Ownership matters as much as cadence. The recruiting lead should own the weekly operational view since it drives daily decisions. Talent acquisition ops or an HR analyst typically owns the monthly and quarterly strategic reports, and project leadership should see the retention and quality-of-hire trends tied directly to their crews.
When a KPI Moves: Diagnosis and What to Fix
A KPI moving in the wrong direction is a symptom, not a diagnosis. Work through the cause before you change anything.
- Low offer acceptance rate: Check compensation against current local market rates first, then review candidate experience friction, slow decision timelines, unclear start dates, and poor communication during the offer stage.
- Poor 90-day retention: Review onboarding structure before blaming the hire. Missing safety orientation, unclear reporting lines, and no 30-day check-in are common, fixable causes.
- Long time-to-hire: Check requisition approval delays and interview scheduling gaps before assuming the candidate pool is thin. Internal bottlenecks cause more delay than market scarcity in most cases.
Once you’ve diagnosed the likely cause, run one intervention at a time, structured interview guides, a referral bonus increase, a revised offer package, or a 30-60-90-day onboarding checkpoint, and give it a full hiring cycle (typically 60 to 90 days) before judging results.
Pro Tip: Watch leading indicators during the test window, like interview-to-offer conversion or early engagement scores, rather than waiting for the lagging 90-day retention number to tell you whether the change worked.
How Petra Talent Applies KPIs to Mechanical Construction Hiring
Petra Talent builds its process around the same KPI discipline this guide describes, applied specifically to HVAC and plumbing contractors. Technical vetting and screening directly improves quality-of-hire scores by filtering for job-fit before a candidate ever reaches a client interview. Role-specific sourcing shortens time-to-hire for skilled trade and leadership searches alike. Workforce consultation helps contractors set realistic, role-segmented targets instead of guessing at a single company-wide number.
The workflow looks like this: intake conversation to understand the role and urgency, KPI selection matched to that role family, a dashboard tracking pipeline health against agreed targets, and intervention recommendations when a number drifts off course.
A search that moves fast but produces a technician who quits in six weeks isn’t a win. Measuring quality alongside speed is what separates a filled requisition from a staffed jobsite.
Contractors wanting a closer look at how this applies to their own roles can review Petra Talent’s services or start a benchmarking conversation directly.
Examples of Effective Recruiting KPI Implementation in Construction
A mechanical contractor tracking time-to-hire alone had been filling superintendent roles in an average of 52 days, but nearly a third of those hires left within the first year. Adding a 90-day retention KPI and a structured interview requirement to the process didn’t speed up hiring. It slowed the front end slightly while cutting first-year turnover, which meant fewer repeat searches and less schedule disruption overall.

Another common pattern shows up in source effectiveness tracking. A contractor relying heavily on general job boards discovered, once they broke out cost-per-hire and 90-day retention by channel, that a trade school partnership produced hires at a higher upfront cost but with retention nearly double the job-board average. Reallocating budget toward that channel lowered total cost per retained hire even though the per-posting cost looked worse.

The common thread in both cases: neither improvement came from a single metric. It came from pairing a leading indicator (source cost, interview structure) with a lagging outcome (retention, turnover) and letting the combination guide the decision, exactly the leading-and-lagging approach that prevents blind spots in workforce analytics.
Turn KPI Tracking Into Staffing Readiness
Recruiting KPIs only pay off when they connect directly to your project mobilization dates, not when they sit in a spreadsheet no one reviews between hiring cycles. Contractors who fold hiring metrics into workforce planning avoid the scramble of discovering a staffing gap two weeks before a project start date. Petra Talent’s workforce planning consultation helps HVAC and plumbing contractors build that connection, translating KPI targets into a staffing calendar that matches your actual project pipeline instead of guessing at headcount needs after the fact.
What Actually Moves the Needle in Construction Recruiting
Quality-of-hire measurement, paired with disciplined time-to-hire and cost-per-hire tracking, produces staffing outcomes that hold up past the first paycheck.
| Point | Details |
|---|---|
| Prioritize the trio | Track quality of hire, time-to-hire, and cost-per-hire first; add the other four KPIs once these are stable. |
| Segment by role family | Set separate baselines and targets for field leadership, skilled trades, and technical/office roles. |
| Split dashboards by cadence | Watch requisition age and pipeline weekly; review cost-per-hire and retention trends monthly or quarterly. |
| Diagnose before you intervene | Check compensation, onboarding, or internal approval delays before assuming a KPI drop means the talent pool is thin. |
| Tie hiring to mobilization dates | Calculate a time-to-start KPI that connects requisition approval to on-site start for schedule-critical roles. |
What This Guide Gets Right That Most KPI Advice Misses
Most recruiting KPI content treats construction like any other industry, one time-to-hire number, one cost-per-hire average, one retention rate. That approach fails the moment you apply it to a company hiring superintendents and pipefitters through the same dashboard. The roles don’t behave the same, so the targets shouldn’t either.
The bigger gap in conventional advice is the near-total absence of quality of hire as a real, measured number. Most contractors track it informally, if at all, relying on manager gut-feel months after the hire started. That’s backwards. A composite score built from 90-day supervisor ratings and retention status isn’t perfect, but it beats waiting a year to find out a hire wasn’t the right fit.
If you take one thing from this guide, prioritize segmentation over averages. A single company-wide time-to-hire number tells you almost nothing useful. A number broken out by role family, checked against retention, tells you where your process actually needs work.
— David
Sources
The construction hiring benchmarks and formulas in this guide draw on the following sources:
- Construction Hiring Statistics 2026: Placement-Verified Data — Amundson Group
- What is quality of hire? — Predictive Index
- Irecruit
Recommended
Post a comment
Related Posts

August 29, 2026
Paid Internships That Convert Interns to Hires for HVAC Trade Schools
Contractor playbook to launch HVAC trade school partnerships. Use paid internships and PAC involvement to…

August 28, 2026
Diversity Hiring in the Trades: A Contractor’s Action Plan
Explore actionable strategies for improving diversity hiring in the trades. Enhance outreach, retention, and career…

August 26, 2026
Plumbing Estimator Hiring: A Contractor’s Playbook
Discover how to efficiently hire a plumbing estimator by leveraging multiple sourcing strategies and defining…

August 25, 2026
Manpower Loading Construction Schedules: A Practical Guide
Unlock your project's potential with effective manpower loading in construction. Ensure you have the right…