



Manpower loading is the planned workforce, by period, mapped against your schedule, measured in workers or labor-days per week or month. It answers one question that trumps almost every other planning metric: do you have enough hands, at the right time, to hit the dates you promised?
The immediate action is simple. Build a planned-versus-actual manpower histogram before you commit to a schedule, and stress-test the peak period for realism using standard man-day math. If the peak looks impossible to staff, it probably is.
- Define manpower loading in man-days or workers per period, not just total headcount
- Chart planned vs. actual on a histogram to catch feasibility problems early
- Treat the peak week as the riskiest week on the entire project
Key Takeaways
Manpower loading works when the histogram’s peak matches both the schedule’s real sequencing logic and a hiring timeline capable of delivering that peak on time.
| Point | Details |
|---|---|
| Build the histogram first | Chart planned vs. actual manpower by period before finalizing bid or mobilization numbers. |
| Use the man-day formulas | Calculate man-days ÷ (crew size × shift factor) and add a 10% to 25% buffer for real conditions. |
| Watch for simultaneous peaks | Flat plateaus or stacked trade peaks in the same week signal a sequencing error, not good planning. |
| Track skill mix, not just headcount | A shortage of licensed trades stalls work faster than a shortage of general labor. |
| Align hiring with the baseline curve | PetraTalent’s direct-hire and vetting services close mobilization gaps before they hit the peak week. |
Table of Contents
- What Do Typical Manpower-Loading Curves Look Like?
- How Do You Calculate Manpower Requirements for a Project?
- How Do You Build a Manpower Histogram Step by Step?
- Where Does Manpower Loading Change Real Decisions?
- What Tools Should You Use for Loading Calculations?
- What Mistakes Wreck a Manpower-Loading Plan?
- How Does Manpower Loading Affect Project Cost and Budgeting?
- How Should Manpower Loading Tie Into the Overall Schedule?
- What Role Does Manpower Loading Play in Site Safety?
- How Do Skill Levels Affect Manpower Loading Decisions?
- How Do You Adjust Manpower Loading for Weather and Availability Gaps?
- What Do Successful Manpower Loading Strategies Look Like in Practice?
- What PetraTalent Sees Connecting Staffing to Manpower Loading
- How PetraTalent Closes the Gap Between Planned and Actual Manpower
- Sources
What Do Typical Manpower-Loading Curves Look Like?
Most construction projects follow an asymmetrical bell curve rather than a symmetrical one. Workforce ramps up slowly during mobilization, holds a broad plateau through the middle of the job, and tapers faster at closeout than it built at the start. Classic project-management research, including Max Wideman’s manpower loading data, shows peak staffing typically lands between 50% and 75% of the schedule duration.
By the numbers: Peak manpower can run as high as 160% of the project’s average workforce level, according to Wideman’s analysis of historical loading data.
The asymmetry comes from trade sequencing. Structural and mechanical trades overlap heavily in the middle phase, procurement lead times push finish trades later, and fast-tracking compresses activities that would otherwise run sequentially. If your histogram shows a flat plateau or a symmetrical curve, question your logic.
How Do You Calculate Manpower Requirements for a Project?
Two formulas cover most of what a scheduler needs:
- Man-days = scope quantity ÷ productivity rate. If you’re pouring 2,400 square feet of slab at a crew rate of 400 square feet per day, that’s 6 man-days of labor for the finishing crew.
- Duration = man-days ÷ (crew size × shift factor). A shift factor of 1.0 represents a standard 8-hour, single-shift day. Extended shifts or double shifts push that factor above 1.0.
The manpower planning calculator methodology recommends layering in adjustments before you lock a number: overtime availability, weather-driven productivity loss, and a learning curve for new crews on unfamiliar work.
By the numbers: Contractors commonly add a buffer of 10% to 25% on top of calculated peak workforce to absorb weather, subcontractor variability, and ramp-up inefficiency.
Worked example: Say a fit-out package needs 480 man-days of finish carpentry, and the schedule allows 20 working days for that scope. Divide 480 by 20, and you need 24 workers per day at a shift factor of 1.0. That’s the number you check against site access, parking, and break-room capacity before you commit it to the schedule. If 28 carpenters can’t physically work the space without tripping over the electrical crew already there, the duration assumption is wrong, not the math.
How Do You Build a Manpower Histogram Step by Step?
A histogram turns your schedule into a workforce forecast you can actually manage day to day. The process is mechanical once you set it up correctly.
- Pull activity-level man-days by trade from your baseline schedule or estimate.
- Allocate each activity’s man-days across the reporting periods it spans, then divide by working days per period to get workers-per-period.
- Plot planned workers against actual headcount, updated weekly from daily site records.
- Keep contractor and subcontractor manpower on separate series so shortages by trade don’t hide inside a blended total.
Building a labor histogram in Excel works well for most mid-size projects because the underlying logic is transparent and easy to audit.
| Template column | What it captures |
|---|---|
| Activity / trade | Links histogram data back to the schedule line item |
| Man-days (planned) | Total labor allocated to that activity |
| Period allocation | Man-days spread across weeks or months |
| Workers per period | Man-days divided by working days in that period |
| Actual headcount | Daily site count, updated from timesheets or badge data |
| Variance | Planned minus actual, flagged when it exceeds your threshold |
A resource histogram works best when reviewed alongside your Gantt chart and S-curve, not as a standalone artifact.
Where Does Manpower Loading Change Real Decisions?
Manpower loading isn’t an academic exercise. It changes what you bid, how you mobilize, and what you can prove after the fact.
- Tendering: A trade-by-trade manpower histogram tests whether your bid price assumes a crew size the local labor market can actually supply, especially for projects requiring seasonal buffers in extreme heat or cold.
- Mobilization sizing: The peak number from your histogram tells you how many workers to have under contract, not just on a wish list, before the critical phase starts.
- Recovery planning: When a project falls behind, a proposed recovery schedule that doubles manpower overnight without a credible sourcing plan behind it isn’t a recovery plan. It’s wishful thinking on paper.
- Claims support: Planned-versus-actual manpower data is often the clearest evidence in a delay claim, because it shows whether the contractor had the labor on hand to meet the baseline schedule or fell short through no fault of the owner.
What Tools Should You Use for Loading Calculations?
Tool choice depends on project size and how much manpower data you need to track across a portfolio, not just one job.
- Spreadsheets handle single projects well. They’re transparent, easy to customize, and sufficient for most general contractors running one or two active jobs.
- Dedicated manpower calculators speed up the man-day and duration math, especially useful when estimating dozens of activities during preconstruction.
- PM suites with built-in resource histograms connect your manpower plan directly to the schedule, so a logic change updates the workforce curve automatically.
- Integrated workforce-management platforms, like the resource-management tools described by Procore, unify scheduling, payroll, and field data, which matters most for multi-project contractors juggling shared labor pools.
Pro Tip: If your spreadsheet histogram needs manual updates more than once a week to stay accurate, that’s your signal to move up to an integrated platform.
Academic researchers have also built simulation tools for manpower forecast loading and resource leveling, useful if you need optimization beyond what a spreadsheet or off-the-shelf calculator can model.
What Mistakes Wreck a Manpower-Loading Plan?
Most bad manpower plans share the same handful of root causes, and they’re avoidable once you know to look for them.
- Simultaneous-peak assumptions. Stacking every trade’s individual peak into the same week inflates total manpower and ignores that trades rarely peak in unison.
- Ignoring trade dependencies. A manpower plan that doesn’t respect sequencing creates site congestion that quietly drags down productivity for every crew on site, not just the one that’s behind.
- Weak actuals capture. If daily headcount comes from memory instead of timesheets or badge data, your variance column is fiction.
Pro Tip: A flat, unbroken plateau across several weeks in your histogram is usually a red flag, not good planning. Real schedules have texture.
Fixes are straightforward: re-sequence trades by accessible workface, apply your buffer percentage before committing to a bid number, and check hiring lead times against your planned ramp-up date, not your ideal one.
How Does Manpower Loading Affect Project Cost and Budgeting?
Labor is usually the single largest controllable cost category on a construction budget, and manpower loading is what turns a lump-sum labor estimate into a cash-flow-accurate one. A flat average headcount assumption hides the true cost curve. Peak periods draw down cash faster than the budget’s monthly average suggests, and if your finance team is forecasting draws against an average instead of the actual loading curve, you’ll hit a cash crunch during the busiest weeks even on a profitable job.
Overtime is where manpower loading pays for itself fastest. A histogram that flags an unrealistic peak gives you the option to add crew early, at straight time, instead of compressing the same man-days into fewer weeks at time-and-a-half or double-time rates. That difference compounds quickly on a peak week running 30 or 40 workers.
Underloading has its own cost signature. A schedule that assumes fewer workers than the man-day math supports either slips its dates or forces a late-stage overtime scramble, both of which erode margin. Overloading carries a subtler cost: congestion. Packing too many workers into a confined workface reduces output per worker, so the extra bodies you budgeted for don’t translate into the productivity gain you expected.
Budgeting against a validated manpower histogram, rather than a lump-sum labor allowance, gives your cost team a period-by-period spend forecast that lines up with when the money actually leaves the project, not just when the total labor bill comes due.
How Should Manpower Loading Tie Into the Overall Schedule?
Manpower loading only means something in the context of the critical path. A histogram built independently of your CPM logic is just a guess dressed up as data, because it doesn’t reflect which activities can slip and which can’t.
The connection runs both ways. Your critical path determines which activities drive the schedule end date, and those activities’ man-day requirements should carry the most scrutiny in your loading plan. Meanwhile, a manpower constraint discovered in the histogram, like a trade that can’t supply enough crew during the planned window, needs to feed back into the CPM network as a resource-driven logic tie, not get ignored because the float looks generous on paper.
Near-critical activities deserve particular attention. An activity with two weeks of float and a manpower peak that assumes optimistic crew sizes can become critical fast if that peak doesn’t materialize on schedule. Reviewing manpower loading alongside float consumption, not just alongside dates, catches that risk before it becomes a delay.
Software that generates a resource histogram directly from the CPM schedule keeps these two views synchronized automatically. When you resequence an activity, the workforce curve updates with it, so you’re never comparing a stale manpower plan against a schedule that’s already moved on.
What Role Does Manpower Loading Play in Site Safety?
Overcrowded workfaces are a safety problem before they’re a productivity problem. A manpower plan that stacks too many trades into the same physical space during the same period, often the result of a simultaneous-peak assumption, creates the exact conditions that drive struck-by incidents, trip hazards, and congested egress routes.

Manpower loading gives safety managers a forward-looking tool instead of a reactive one. If your histogram shows 45 workers on a floor plate that safely supports 30, that’s a planning failure you can fix weeks in advance by resequencing trades or staggering shifts, not a problem you discover the hard way once the crews show up.
Compliance considerations layer on top of the raw headcount number. Confined-space work, fall-protection zones, and hot-work permits all have crew-density and supervision ratios tied to them. A manpower histogram broken down by trade and by area lets a safety manager check those ratios against the plan before the peak week arrives, rather than during a surprise inspection.
New-worker ramp-up matters here too. A peak staffed heavily with recently hired crew, brought on fast to hit a tight mobilization date, carries different safety risk than the same headcount made up of workers who know the site. Loading plans that ignore crew experience level when calculating peak workforce are missing a variable that shows up in incident rates, not just productivity numbers.
How Do Skill Levels Affect Manpower Loading Decisions?
A raw headcount number hides more than it reveals if you don’t break it down by skill level. Twenty-four bodies on a fit-out crew means something very different if eighteen are apprentices than if eighteen are licensed journeymen, and your man-day productivity rate should reflect which mix you’re actually planning to staff.
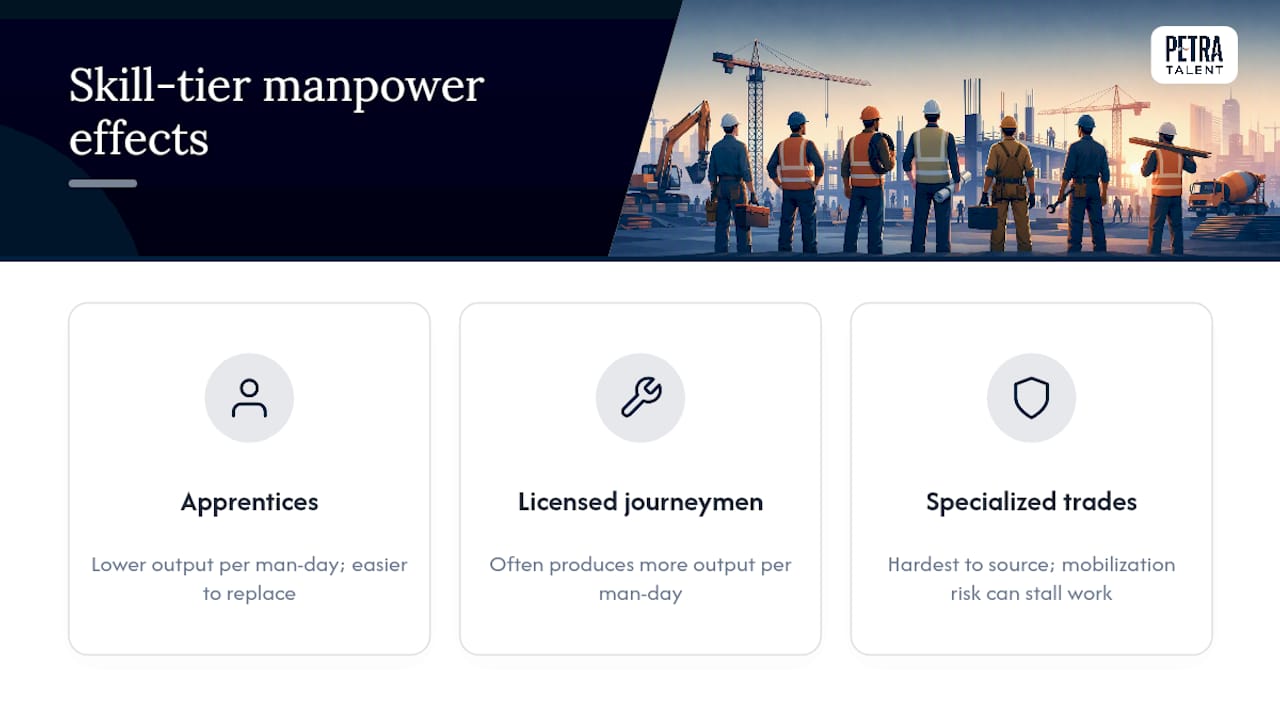
Specialization changes the math in both directions. A licensed electrician or a certified welder often produces more output per man-day than an unspecialized laborer on the same task, which means your productivity rate assumption needs to match the actual crew composition, not an industry-average number pulled from a generic table. Conversely, specialized trades are usually the hardest to source on short notice, which means their portion of the peak workforce carries more mobilization risk than the general labor portion does.
Building skill tiers into your histogram, rather than tracking one blended headcount line, exposes where the real staffing risk sits. A shortage of ten general laborers is an inconvenience you can usually solve with a phone call. A shortage of three licensed HVAC technicians during the same peak week can stall the entire mechanical rough-in, because there’s no fast substitute for a credential the work requires. Schedulers who track manpower loading only in aggregate miss this distinction until it’s already a delay.
How Do You Adjust Manpower Loading for Weather and Availability Gaps?
No manpower plan survives contact with a labor market shortage or three straight weeks of rain unmodified, and building in adjustment triggers ahead of time beats reworking the histogram after the damage is done.
Weather adjustments work best when tied to historical productivity loss for your region and trade, applied as a percentage reduction to planned output rather than a flat headcount cut. A concrete crew that loses 20% of its productive hours to cold-weather protection measures needs either more man-days scheduled or a longer duration, and the histogram should show which choice you made, not just absorb the loss silently into a slipping finish date.
Labor availability fluctuations often follow a predictable seasonal pattern, particularly for trades that compete with residential construction during peak building season. If your regional market historically tightens in the spring, build that into your hiring lead-time assumptions months before the peak week arrives, not when the mobilization date is already two weeks out.
The practical fix in both cases is the same: build a trigger point into your monitoring, whether that’s a rolling weather-day count or a hiring-pipeline checkpoint, and revise the histogram the moment that trigger fires rather than waiting for the variance to show up in an already-late actual headcount number.
What Do Successful Manpower Loading Strategies Look Like in Practice?
A mid-rise residential project running a tight mobilization window benefits most from front-loading manpower loading into the tender phase. Estimating trade-by-trade man-days before pricing the bid, then checking the calculated peak against realistic local crew availability, catches an unstaffable peak before it becomes a contractual problem instead of after.
On a heavy industrial or process plant job, where dozens of trades overlap during the mechanical and electrical rough-in phase, the winning pattern is usually staggered sequencing by workface rather than by trade. Instead of scheduling every mechanical contractor to peak in the same three weeks, successful projects break the workface into zones and stagger the peak by zone, which keeps the total site headcount within a manageable range even though total man-days stay the same.
Fast-track projects, where design and construction overlap, tend to succeed when the manpower histogram gets rebuilt every time a design package releases late, rather than treated as a one-time preconstruction exercise. The projects that struggle are the ones running an outdated histogram against a schedule that’s already been logic-tied around three procurement delays.
What PetraTalent Sees Connecting Staffing to Manpower Loading
Staffing lead time is the variable most manpower-loading plans underestimate. A histogram can show exactly 28 workers needed by week six, but if licensed technicians take four to six weeks to source and vet, that peak arrives short unless hiring starts against the baseline curve, not the current one.
The practical fix: pull your hiring pipeline forward to match the histogram’s ramp-up point, not the week you expect a gap. Coordinating hiring timelines against schedule feasibility closes that gap before it becomes a missed peak.
— David
How PetraTalent Closes the Gap Between Planned and Actual Manpower
A histogram that shows a 28-worker peak is only useful if you can actually staff it. That’s where most manpower plans quietly break down, not in the math, but in the sourcing timeline behind it. PetraTalent works specifically in HVAC and plumbing recruitment, which means the technicians, project managers, and superintendents filling your peak-week gaps come pre-screened for the exact trade skills your histogram already flagged as critical.
Direct-hire placements shorten the mobilization gap that shows up when your histogram’s ramp-up date arrives faster than a generic hiring pipeline can respond. Technical vetting solves the skill-mix problem covered earlier: a peak staffed with the right ratio of licensed technicians to general labor, rather than warm bodies filling a headcount number. Workforce consultation helps you build hiring lead time into the plan itself, using market wage insights so your labor cost assumptions hold up against the peak you calculated.
If your next histogram shows a peak you’re not confident you can staff on time, explore PetraTalent’s services and get a workforce plan built around the mobilization date you actually need to hit.
Sources
- Some Valuable Manpower Loading Data
- Manpower Planning Calculator (tool description and formulas)
- How to Prepare a Labour Histogram for a Construction Project Using Excel
- What Is a Resource Histogram? (Key Insights & Examples)
- Construction resource management software
Recommended
Post a comment
Related Posts

August 29, 2026
Paid Internships That Convert Interns to Hires for HVAC Trade Schools
Contractor playbook to launch HVAC trade school partnerships. Use paid internships and PAC involvement to…

August 28, 2026
Diversity Hiring in the Trades: A Contractor’s Action Plan
Explore actionable strategies for improving diversity hiring in the trades. Enhance outreach, retention, and career…

August 27, 2026
The Recruiting KPIs Construction Hiring Managers Should Track
Discover essential recruiting KPIs for construction hiring managers. Track metrics like quality of hire and…
August 26, 2026
Plumbing Estimator Hiring: A Contractor’s Playbook
Discover how to efficiently hire a plumbing estimator by leveraging multiple sourcing strategies and defining…