



A single vacant HVAC technician seat typically costs a contractor between $15,000 and $65,000 once every hidden driver is counted, not just the recruiting fee. The biggest piece of that number usually isn’t the job posting or the recruiter invoice. It’s the ramp gap, the months a new hire spends billing below full capacity while the shop absorbs the shortfall. The worksheet and mitigation steps below turn that range into a figure specific to your business.
TL;DR:
- The true cost of an HVAC technician vacancy ranges from $15,000 to $65,000, depending on factors like fill time, ramp-up, and lost revenue.
- Most contractors fail to account for all six cost buckets, including ramp shortfalls, onboarding, overtime, and customer churn, which significantly inflate the expense.
- Filling a technician seat typically takes four to six weeks, with turnover often costing 40% to 50% of a technician’s first-year salary in lost productivity and recruiting.
- Larger shops with high turnover can face annual impacts of hundreds of thousands of dollars, especially when factoring in idle trucks and OPEX.
- Reducing vacancy costs involves quick tactical measures, structured onboarding, and fast, vetted hires to beat competitors and improve cost efficiency.
Table of Contents
- What Does “Cost of Vacancy” Actually Include for HVAC Contractors?
- How Do You Calculate the True Cost of an HVAC Vacancy?
- Is Your Turnover Rate Normal or a Warning Sign?
- What Actually Reduces Vacancy Cost Fastest?
- Why Contractors Consistently Underestimate What a Vacancy Costs Them
- How Petra Talent Shortens the Distance Between “Vacant” and “Fully Ramped”
- Sources
What Does “Cost of Vacancy” Actually Include for HVAC Contractors?
Most contractors track one line item when a technician leaves: the cost to replace them. That’s a mistake. The full financial picture of technician turnover spans six distinct cost buckets, and skipping any of them understates the real damage to your P&L.

Recruiting costs show up first and are the easiest to see. Job board listings run $300 to $500 per posting, trade-specific recruiting platforms charge $1,000 to $3,000 per placement, and staffing agency fees often land at 15% to 25% of first-year salary. Pull these numbers from your accounts payable ledger, not your gut estimate.
Lost billable hours hit next, and they hit hard. A vacant seat means calls that don’t get run.
Onboarding and training time costs money even before a new hire touches a truck. Every hour your senior tech spends riding along with a new hire is an hour that tech isn’t billing.
The ramp gap is the quiet killer. A new hire rarely produces at full capacity from day one; most shops see a multi-month runway before a technician hits full output.
Overtime and premium labor creep in as dispatch tries to plug the hole with existing staff, often at time-and-a-half.
Customer churn closes the loop. Delayed service calls and rescheduled maintenance visits push customers toward competitors who answer the phone faster.
Quick Benchmark: During peak season, the average technician generates $200 to $650 per service call and typically runs 10 to 12 calls a day. That works out to roughly $2,000 to $7,800 in lost daily revenue for every seat sitting empty.
Pull the raw inputs from three places: payroll for labor rates and overtime, dispatch software for calls-per-day and no-show data, and your accounting system for actual recruiting spend. Guessing at any of these numbers defeats the purpose of running the math at all.
How Do You Calculate the True Cost of an HVAC Vacancy?
Building your own worksheet takes five inputs and about fifteen minutes once you have the underlying numbers pulled from payroll and dispatch.
- Gather your inputs. Average revenue per call, gross margin percentage, average calls handled per day, expected time-to-fill in weeks, and recruiting or agency fees.
- Calculate lost margin during the vacancy. Multiply calls per day by revenue per call, apply your margin percentage, then multiply by vacancy days.
- Add direct recruiting and onboarding costs. Include job postings, agency fees, and the hours senior staff spend training the replacement.
- Add the ramp shortfall. Estimate the revenue gap between a new hire’s output and a fully ramped technician’s output, then multiply by the number of months it takes to close that gap.
- Sum all four figures for your total fully loaded vacancy cost.
Here’s how the math plays out under two different assumption sets:
The conservative scenario lands close to the $15,000 to $30,000 range PipelineOn documents for a straightforward replacement. The aggressive scenario, with a longer time-to-fill and a steeper ramp curve, pushes toward the upper end of the $35,600 to $64,000 fully loaded range MarginPlug’s benchmarks report. Your actual number depends almost entirely on how fast you fill the seat and how steep your ramp curve is.
Is Your Turnover Rate Normal or a Warning Sign?
Context matters here. A single departure feels like a one-off problem. A pattern of departures is a business model problem, and the benchmarks separate the two cleanly.
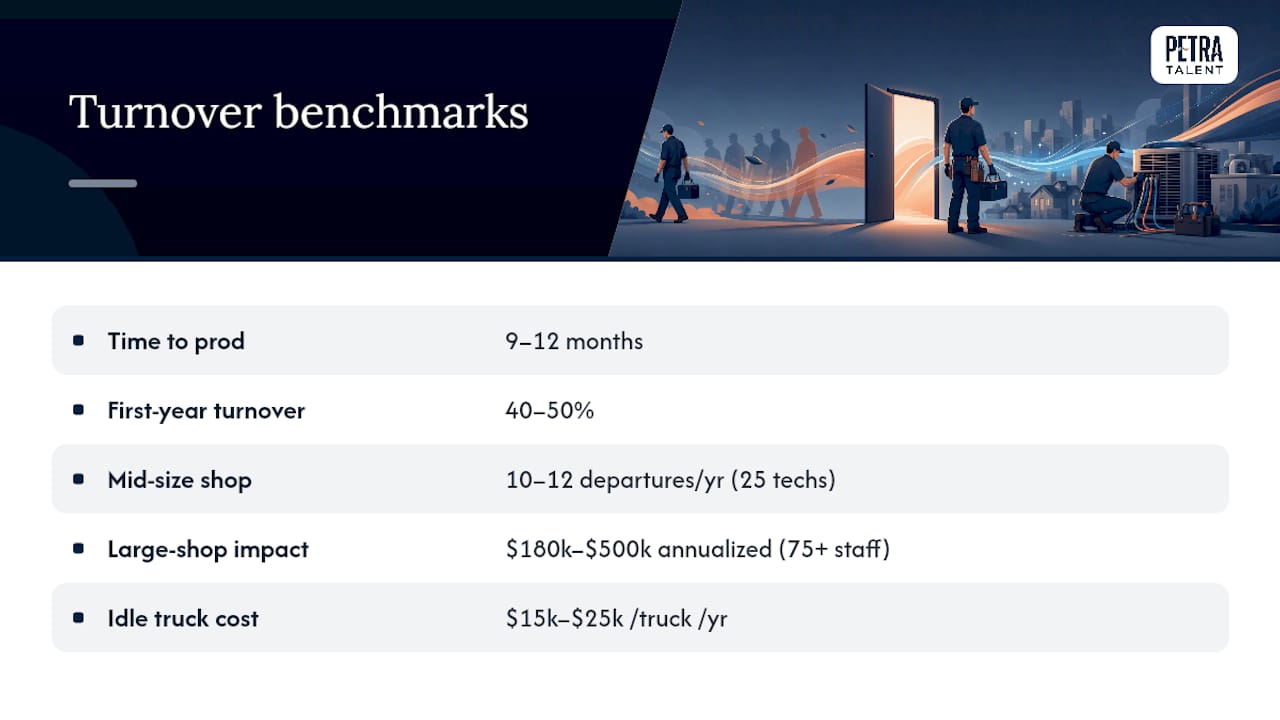
Industry averages sit at 9 to 12 months for a new technician to reach full productivity, with first-year turnover running 40% to 50%. That gap alone represents a meaningful chunk of avoidable cost across a full roster.
Benchmark Callout: A shop running average turnover against a shop running top-quartile turnover isn’t a small difference. It’s the difference between replacing half your bench every year and replacing a fifth of it.
Scale changes the stakes fast. A small shop with 5 technicians losing one tech absorbs a painful but survivable hit. A mid-size shop with 25 techs running average turnover could see 10 to 12 departures a year, each carrying its own recruiting, ramp, and churn cost. A larger regional contractor with 75+ field staff running average turnover can see $180,000 to $500,000 in annualized revenue impact once carrying costs on idle trucks, which run $15,000 to $25,000 per year per vehicle, are layered in.
Labor market pressure is making this worse, not better. Construction trades need hundreds of thousands of net new workers, which stretches time-to-fill windows across the industry and raises the cost of every open seat you carry.
What Actually Reduces Vacancy Cost Fastest?
Fixing this isn’t one move. It’s three layers, and contractors who tackle them in the wrong order waste money.
Short-term, stop the bleeding:
- Deploy pre-vetted temporary or contract staff to cover critical routes immediately.
- Offer sign-on incentives structured with retention paybacks, so the bonus only fully vests if the hire stays.
- Compress your interview-to-offer window; candidates accept competing offers while you deliberate.
Medium-term, fix the leak:
- Build a structured onboarding path with clear milestones instead of informal ride-alongs.
- Create a visible career ladder so techs see a path beyond the truck.
- Review compensation against current market rates, not last year’s budget.
Operational stopgaps while you hire:
- Triage scheduling to protect your highest-margin and most loyal accounts first.
- Bring in paid subcontractors for mission-critical calls rather than pushing overtime on burned-out staff.
Pro Tip: Run your vacancy worksheet before you negotiate a recruiting fee, not after. A $4,000 agency fee looks expensive in isolation, but it looks cheap next to a $50,000 ramp-and-churn bill.
A specialized recruiter or workforce partner earns its place when your internal pipeline can’t keep pace with departures or when technical vetting is eating management hours you don’t have. The right partner should compress time-to-fill measurably and hand you verified, compliance-ready candidates rather than a stack of unscreened resumes.
Why Contractors Consistently Underestimate What a Vacancy Costs Them
Owners undercount vacancy cost because the expenses never show up as one line item on the P&L. Recruiting fees sit in one account, overtime in another, and the ramp shortfall never gets isolated at all. It’s the distributed nature of these costs that hides the real number.
My biggest disagreement with how most shops handle this: they treat hiring speed as a nice-to-have instead of a competitive weapon. A pre-vetted bench and a fast interview-to-offer process isn’t just about filling seats faster. It’s about winning the technicians your slower competitors lose to indecision. Three moves worth making this week: audit your last four departures against the worksheet above, calculate your actual fully loaded cost instead of guessing, and run a 30-day experiment testing one retention lever, whether that’s a scheduling fix or a compensation adjustment.
— David
How Petra Talent Shortens the Distance Between “Vacant” and “Fully Ramped”
Petra Talent exists because most contractors don’t have a spare six months to let a new hire ramp on their own dime. Direct-hire placements, technical vetting, and workforce consultation are built to compress that gap: candidates arrive pre-screened against real field competencies, not just a resume, which cuts the ramp-to-productivity window and the compliance risk that comes with an unvetted hire.

Clients working with a structured HVAC recruiting service typically see faster time-to-fill, verified technical and compliance files on every candidate, and a more predictable cost per hire than piecing together job boards and generalist agencies. If your last few hires took longer than four weeks or didn’t ramp the way you expected, the fix usually starts with better vetting upfront, not more postings after the fact.
Review our full range of workforce services and request a benchmark on your current time-to-fill against top-quartile shops in your region.
Sources
- The Real Cost of HVAC Technician Turnover (2026 Benchmarks) | MarginPlug
- Navigating the HVAC Labor Shortage: How Technology and Talent Development Drive Growth | Contracting Business
- Every Tech Who Quits Costs You $15K-$30K | PipelineOn
- The True Cost of an Unfilled Trades Role | NSC Staffing
Recommended
Related Posts

October 23, 2026
Recruiting Metrics for Contractors: What to Track in 2026
Recruiting metrics for HVAC, plumbing and mechanical contractors: which numbers to track, how to calculate…

October 22, 2026
Candidate Replacement Guarantee: What Contractors Should Know
What a candidate replacement guarantee covers, how long it lasts, what voids it, and how…

October 21, 2026
Candidate Experience in Construction: A Guide for HVAC and Plumbing Contractors
How construction, HVAC and plumbing contractors can improve candidate experience: faster steps, clear communication and…

October 20, 2026
Candidate Non-Solicitation Clause: What Contractors Should Know
How a candidate non-solicitation clause works in HVAC and plumbing hiring, what courts enforce, and…